Financial Analysis · Data Quality · Business Reporting
SF Recreation & Parks
Financial Analysis
How did spending and revenue change at San Francisco's Recreation and Park Department between FY2024 and FY2025? I analyzed public financial records, validated the data, and developed reports to communicate the findings. I then extended the project with interactive Power BI dashboards and a Power Automate workflow that sends report-review notifications.
01 · Executive Overview
What changed between FY2024 and FY2025?
Reported spending increased faster than reported revenue during the two-year period. The analysis identifies where those changes occurred and highlights areas that may benefit from additional management review.
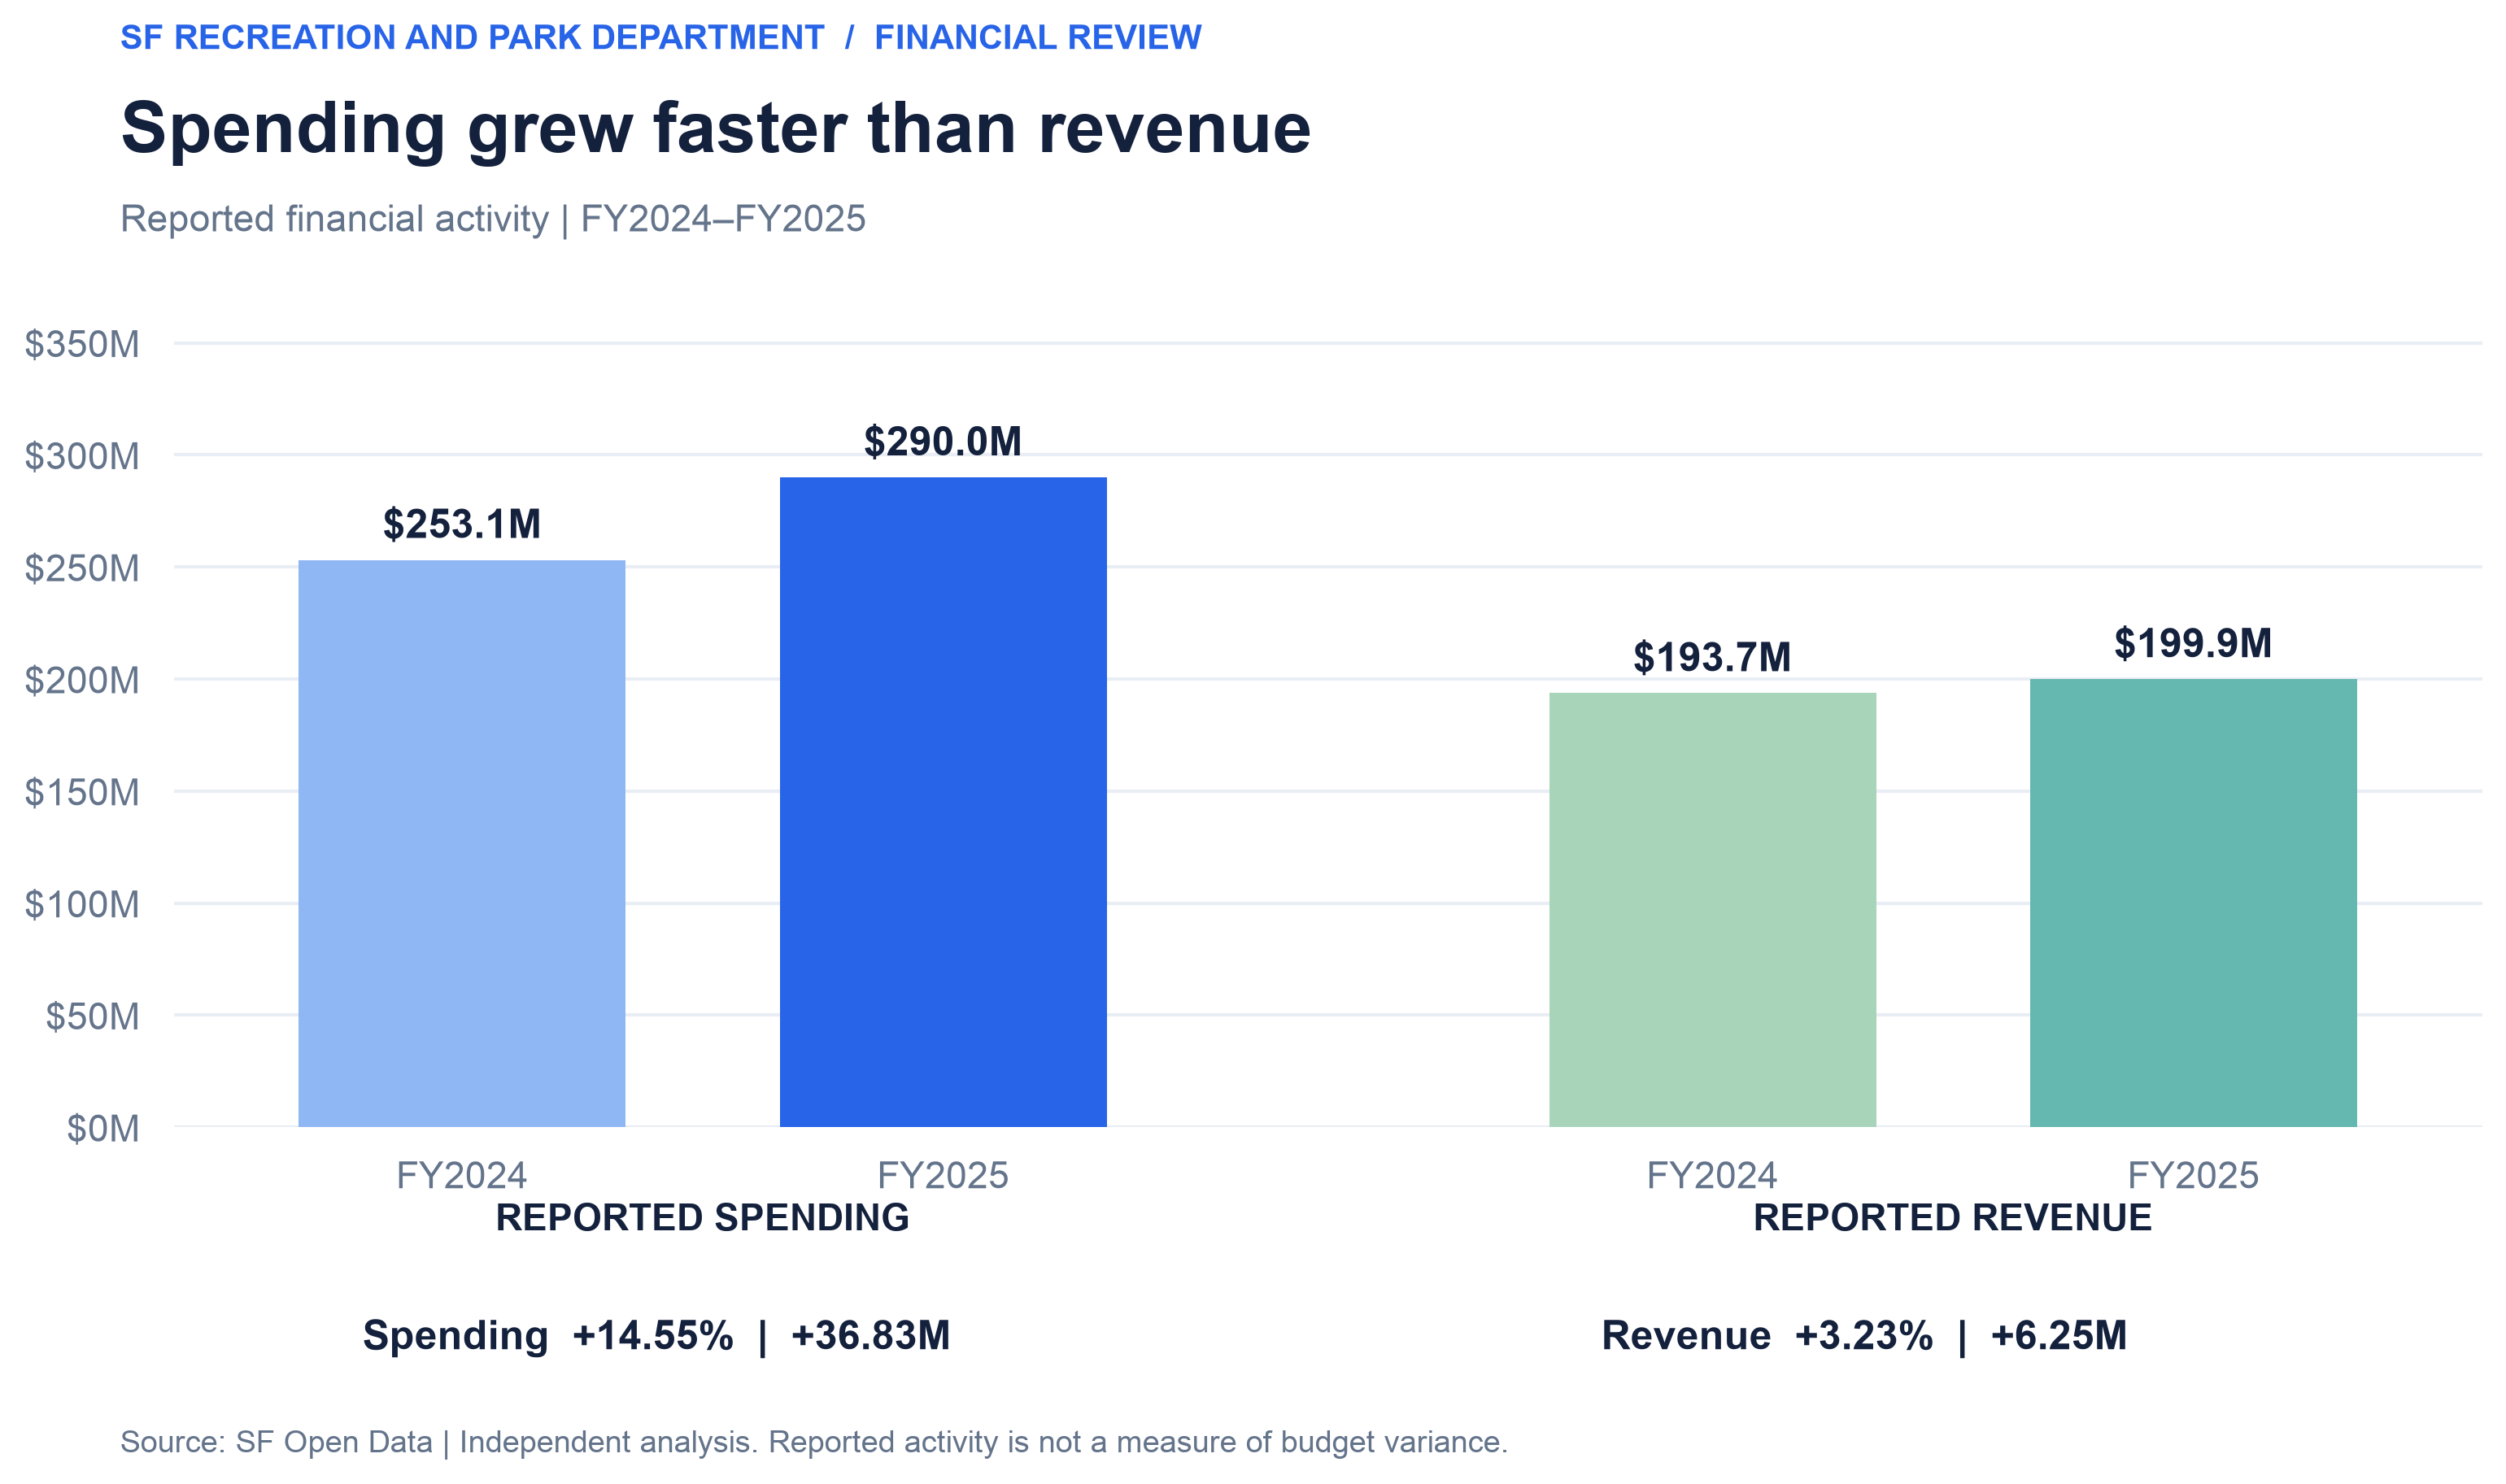
Spending and revenue are reported financial categories, not necessarily directly comparable measures of financial balance. Their difference does not establish a deficit, and increased spending does not establish overspending.
02 · Business Problem
Turning financial records into useful information
Public financial datasets contain detailed transactions and classifications, but they are not always easy to interpret without additional preparation. Managers need reliable summaries that show what changed, which categories contributed to those changes, and where further questions should be asked.
Questions I investigated
How much did reported spending and revenue change? Which programs and revenue sources contributed most to those changes? How can the results be presented accurately without overstating what the data proves?
Project objective
Build a reproducible analytical workflow and produce understandable financial summaries, visualizations, and management-facing reports using official public data.
03 · Data Sources & Preparation
Preparing the financial records
I used San Francisco Open Data budget and spending-and-revenue datasets, focusing on the Recreation and Park Department and fiscal years 2024 and 2025.
The final checks found no missing financial amounts or exact duplicate records in the selected data. Aggregated summaries reconciled with their underlying selected records for both fiscal years.
Reconciliation confirms that the calculated summaries agree with the selected records. It does not independently verify every original accounting classification or establish that the source data is complete.
04 · Analysis Methodology
Comparing financial activity consistently
I aggregated reported financial amounts by fiscal year and calculated both dollar changes and percentage changes. I then examined the individual program and revenue categories contributing to the overall movement.
Dollar change
FY2025 reported amount minus FY2024 reported amount. This shows the absolute size and direction of the change.
Percentage change
Dollar change divided by the FY2024 amount, multiplied by 100. This shows the relative change from the earlier year.
Budgeted figures were reviewed separately because budget and reported financial datasets use different structures and classifications. I did not treat a direct subtraction between them as a verified budget-versus-actual variance.
05 · Spending Analysis
Where did reported spending increase?
Reported spending rose from $253.13 million in FY2024 to $289.96 million in FY2025, an increase of approximately $36.83 million, or 14.55%.
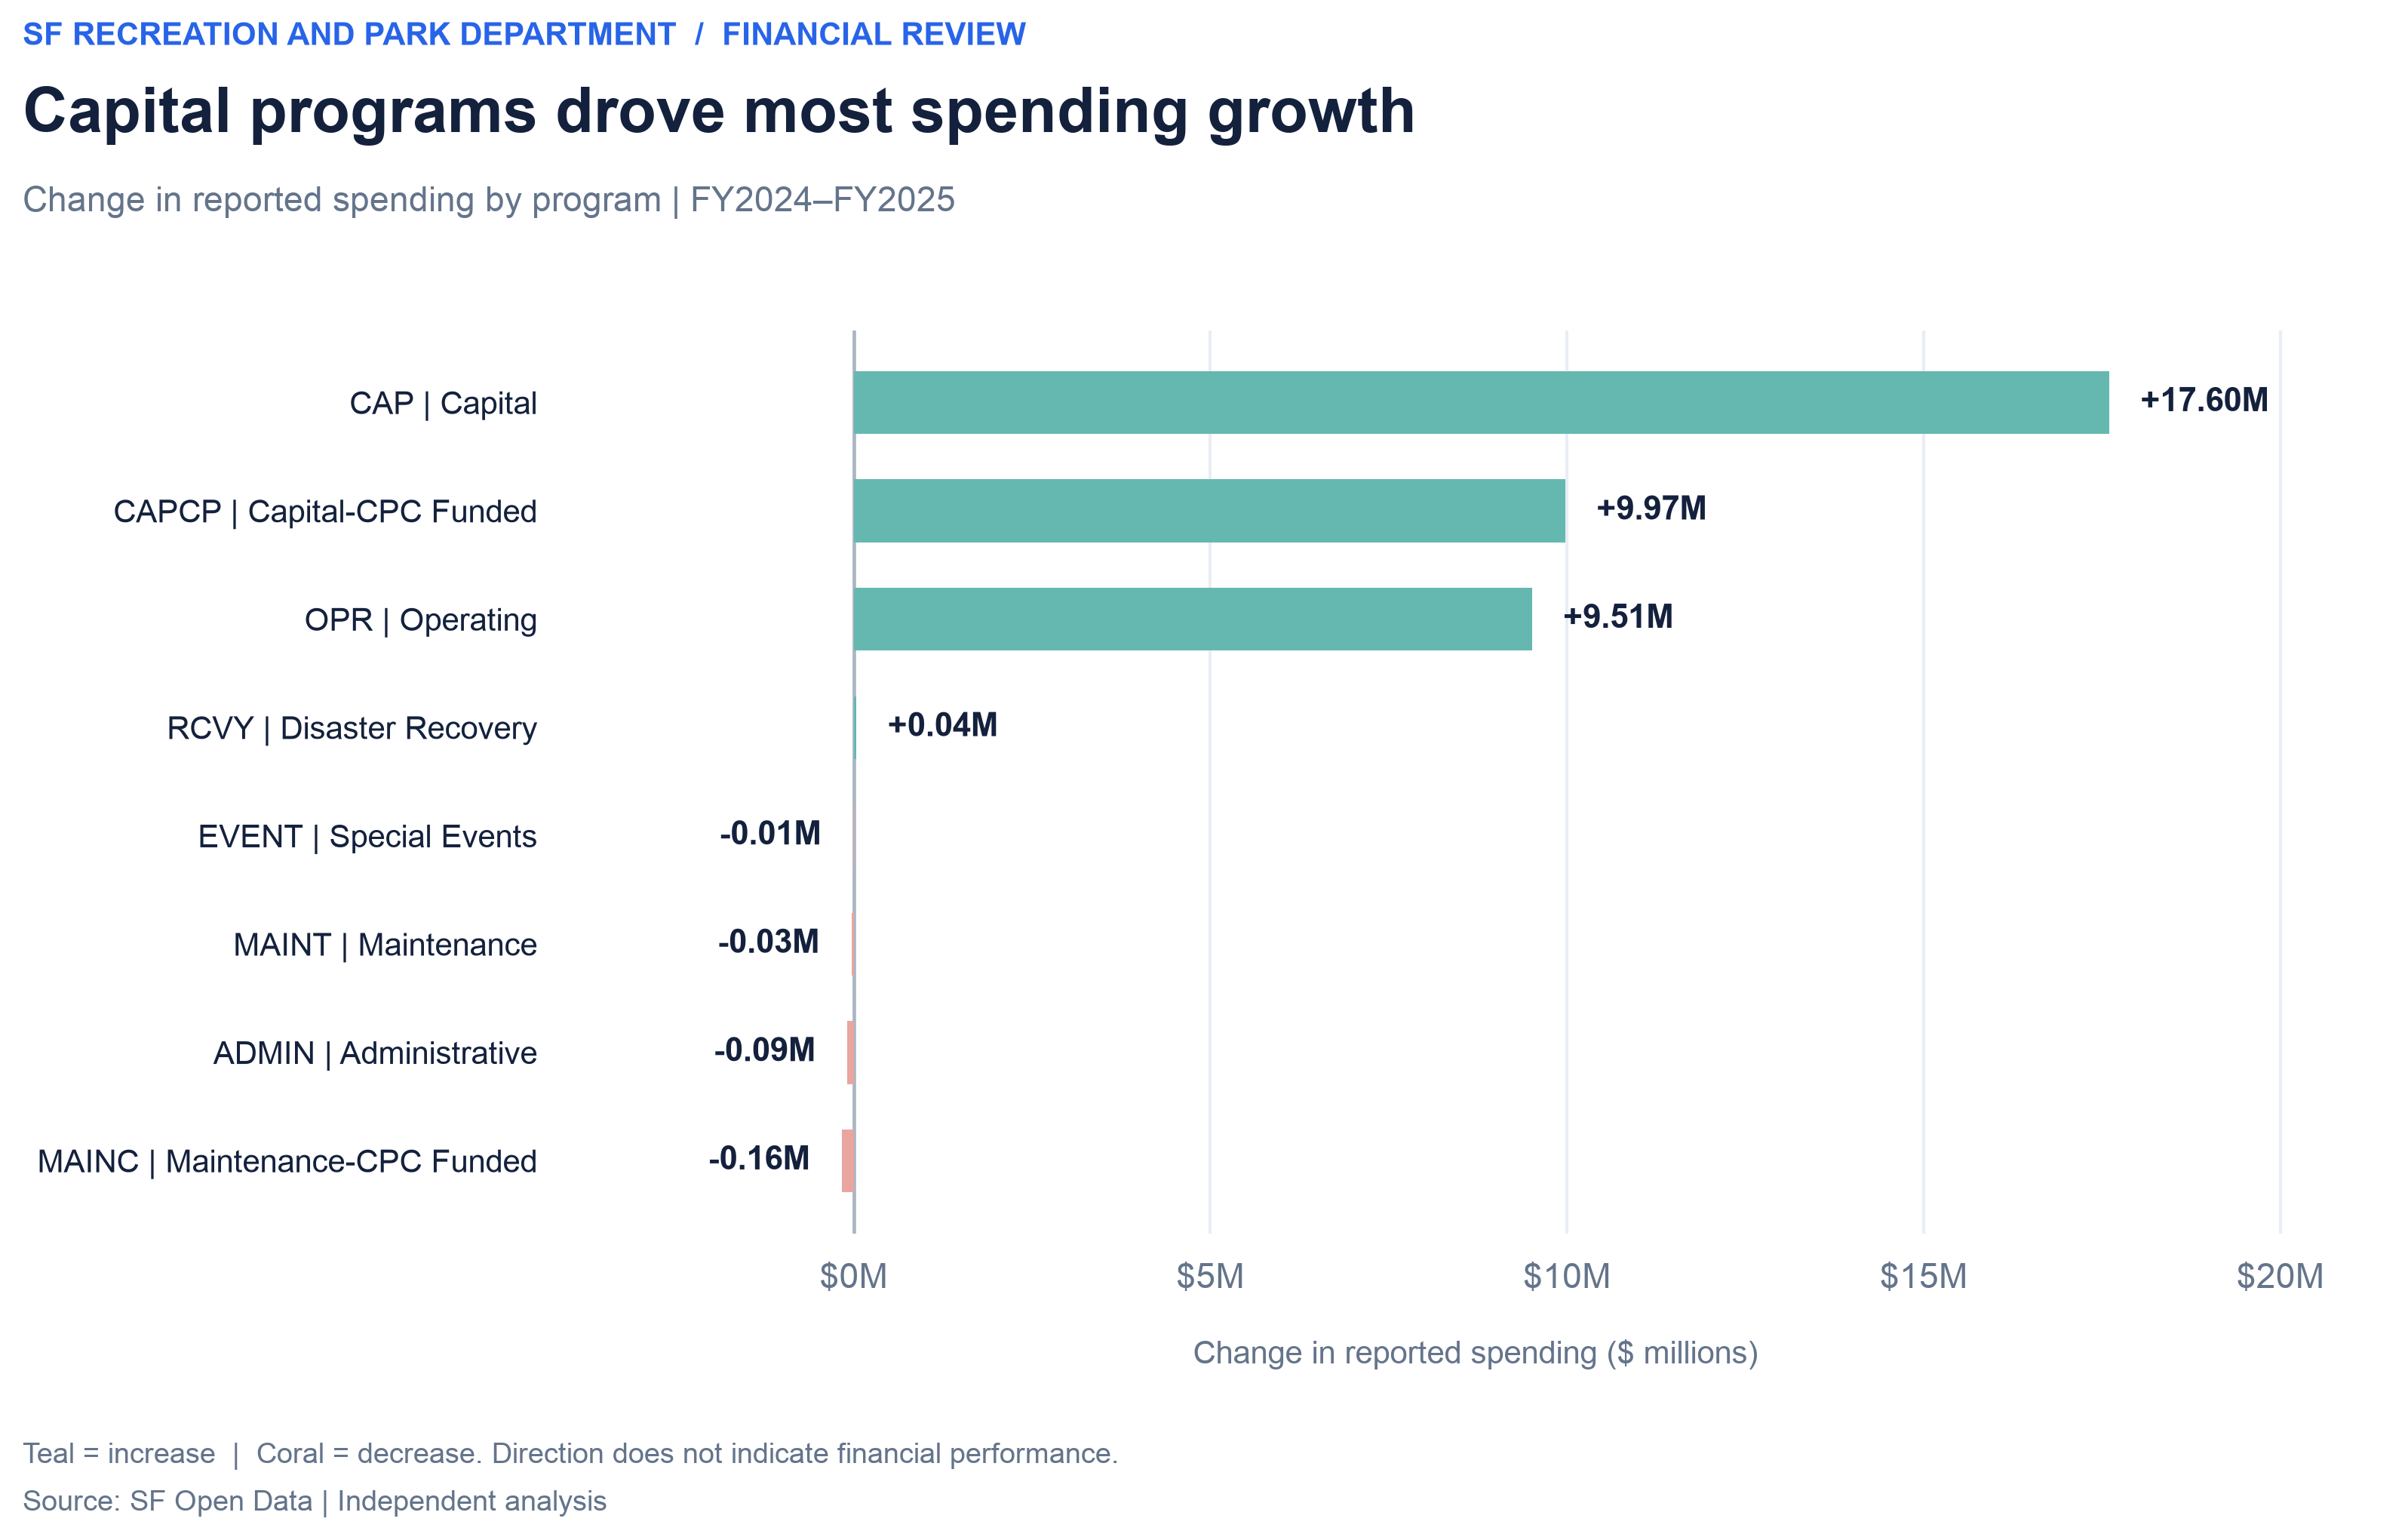
Capital-related activities and operating programs accounted for much of the increase. Capital spending increased by approximately $17.60 million, Capital-CPC Funded by $9.97 million, and Operating by $9.51 million.
These movements suggest that capital project timing, funding arrangements, and operational activity are useful areas for follow-up investigation.
06 · Revenue Analysis
Which revenue sources changed?
Reported revenue increased from $193.67 million in FY2024 to $199.92 million in FY2025, an increase of approximately $6.25 million, or 3.23%. Changes varied substantially across revenue sources.
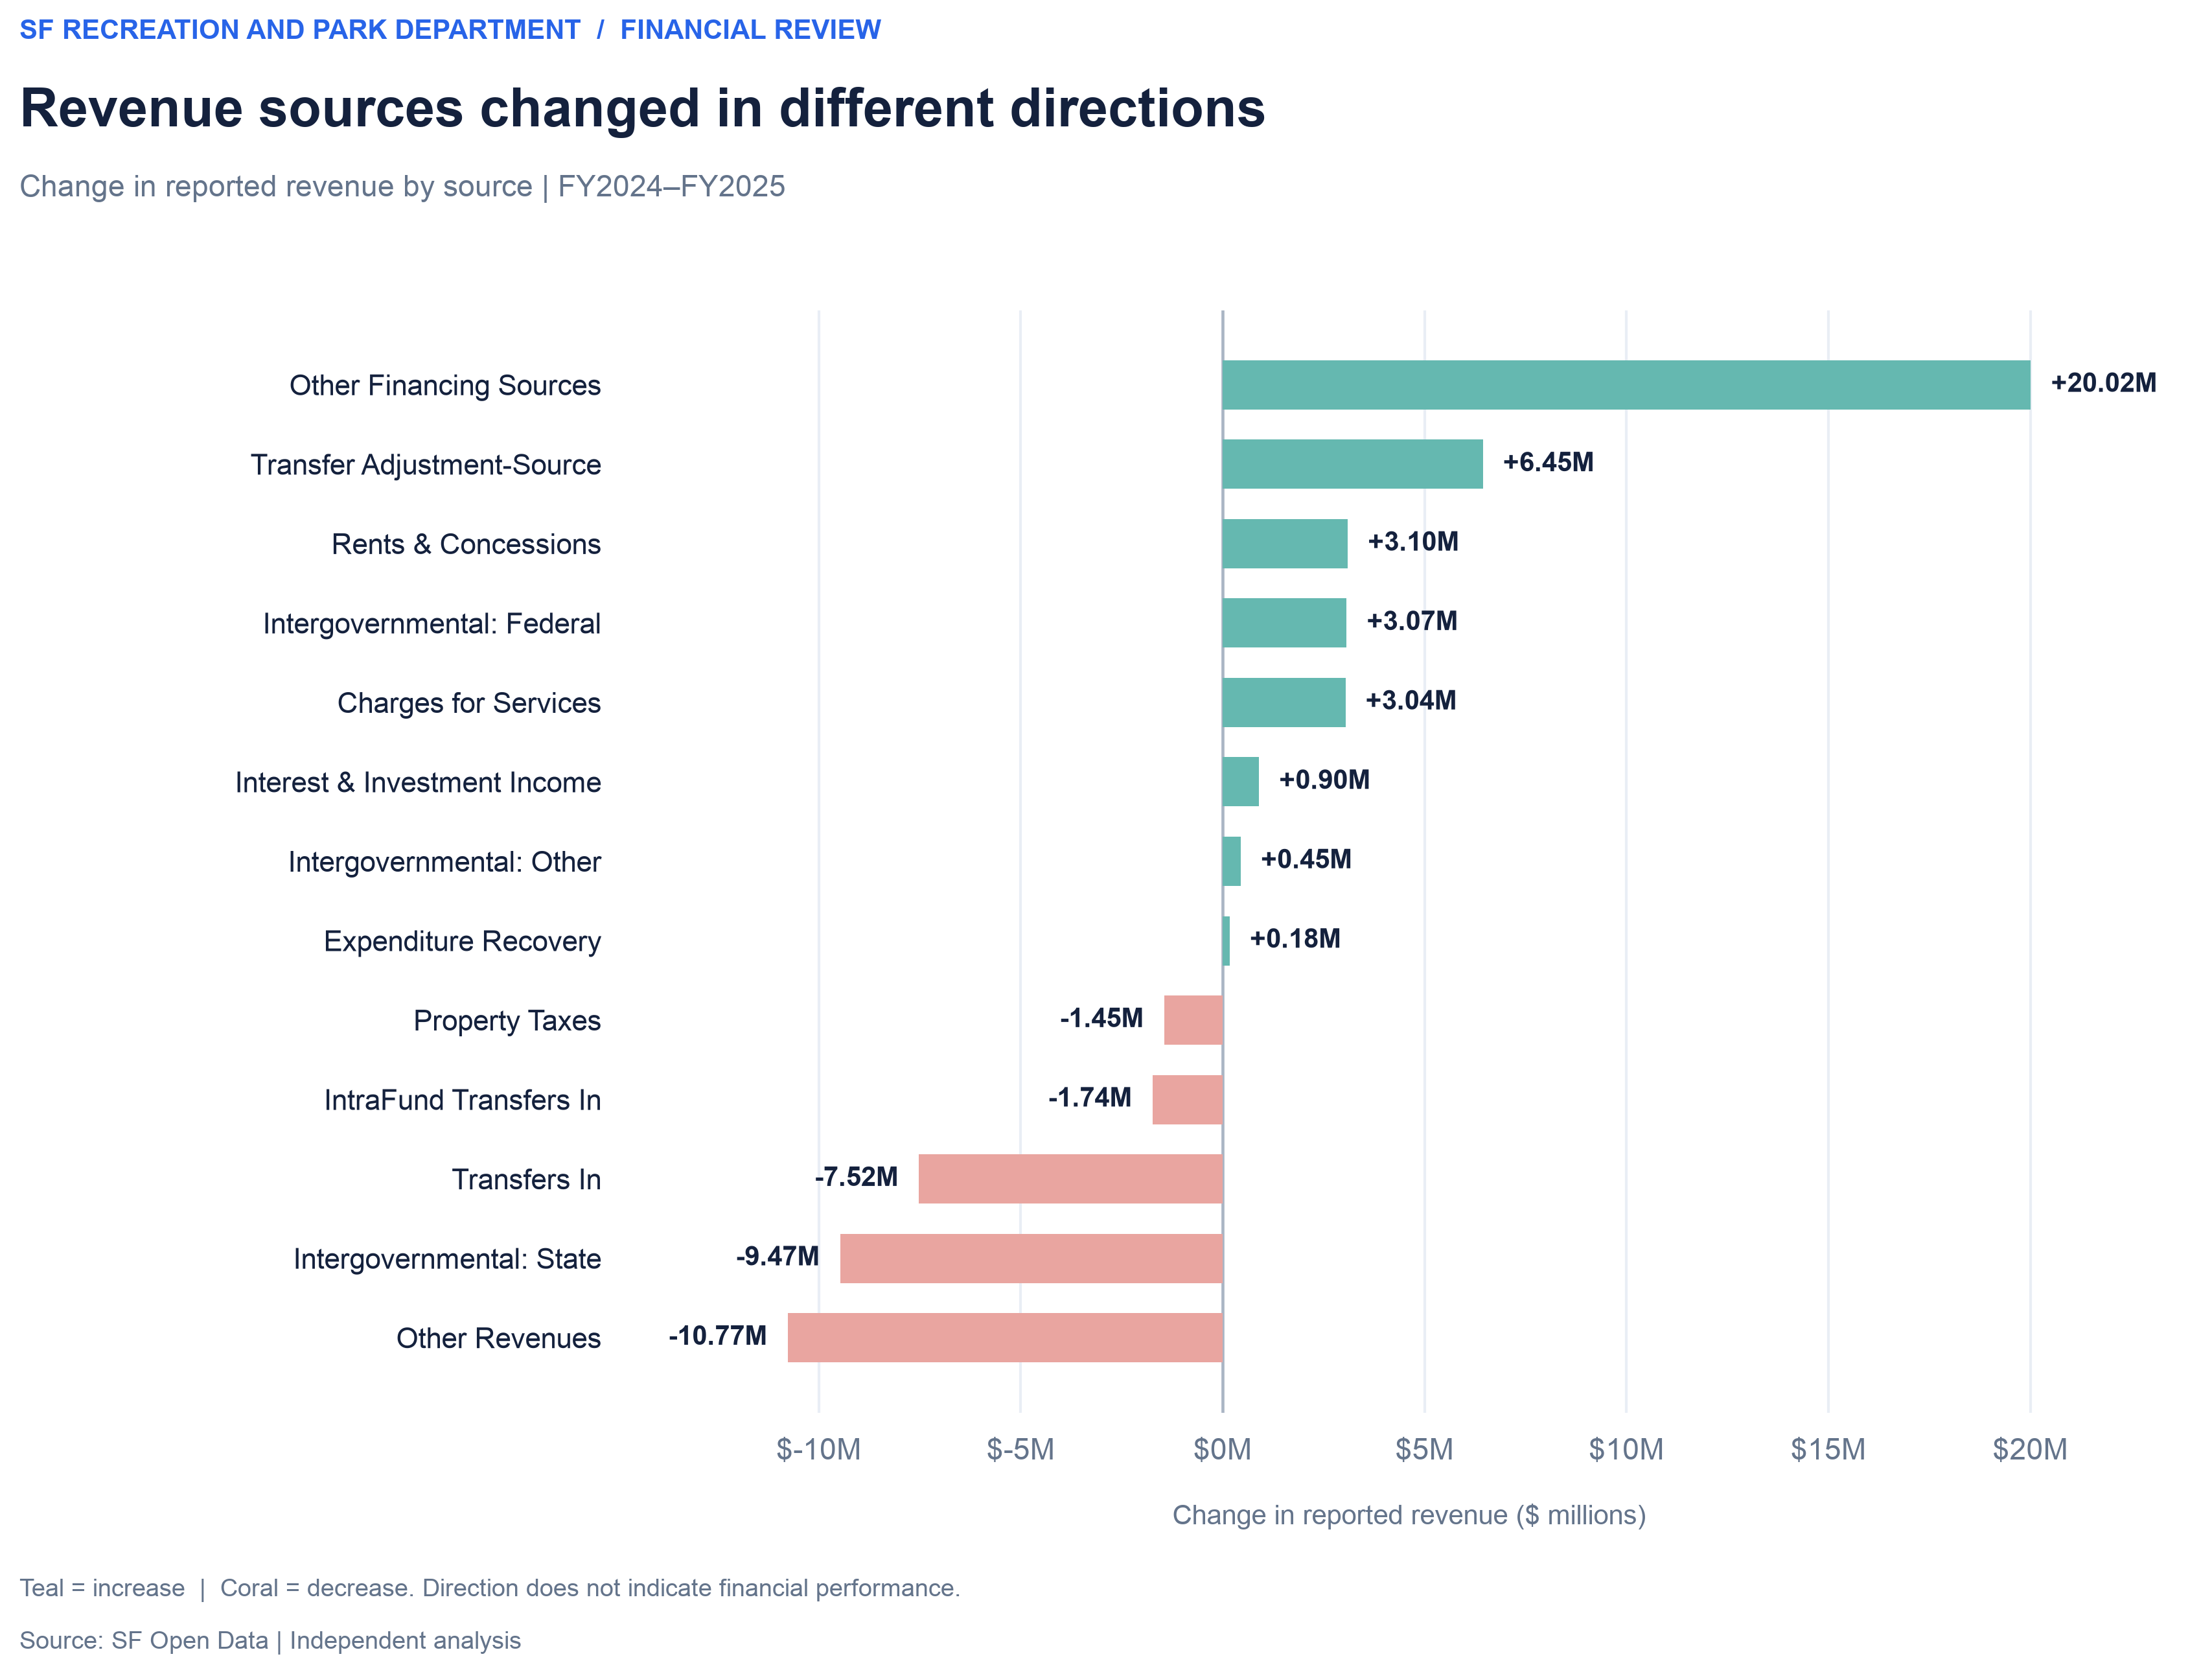
Other Financing Sources increased by approximately $20.02 million, while Transfer Adjustment-Source increased by $6.45 million. These increases were partly offset by decreases in Other Revenues ($10.77 million) and Intergovernmental: State ($9.47 million).
The results demonstrate why examining individual revenue sources is more informative than relying on the total revenue change alone.
07 · Reporting Deliverables
Making the results useful to decision-makers
I translated the analysis into three visualizations, two Excel reporting workbooks, and a one-page management summary. The goal was to make the findings accessible without requiring readers to understand Python or financial-data processing.
08 · Management Implications
What should managers investigate next?
These are suggested areas for additional analysis, not findings of operational failure or financial mismanagement.
09 · Limitations & Lessons
What the data can and cannot establish
This project describes reported financial activity over two fiscal years. It does not establish whether individual expenditures were appropriate, whether budget targets were met, or whether department services became more or less effective.
A key lesson was the importance of separating accurate calculations from unsupported conclusions. A useful financial report should make the results understandable while remaining clear about the limitations of the underlying data.
This analysis uses public San Francisco financial data. It is an independent educational and portfolio project, not an official Recreation and Park Department report or an assessment endorsed by the City and County of San Francisco.
10 · Power BI Extension
From financial analysis to interactive reporting
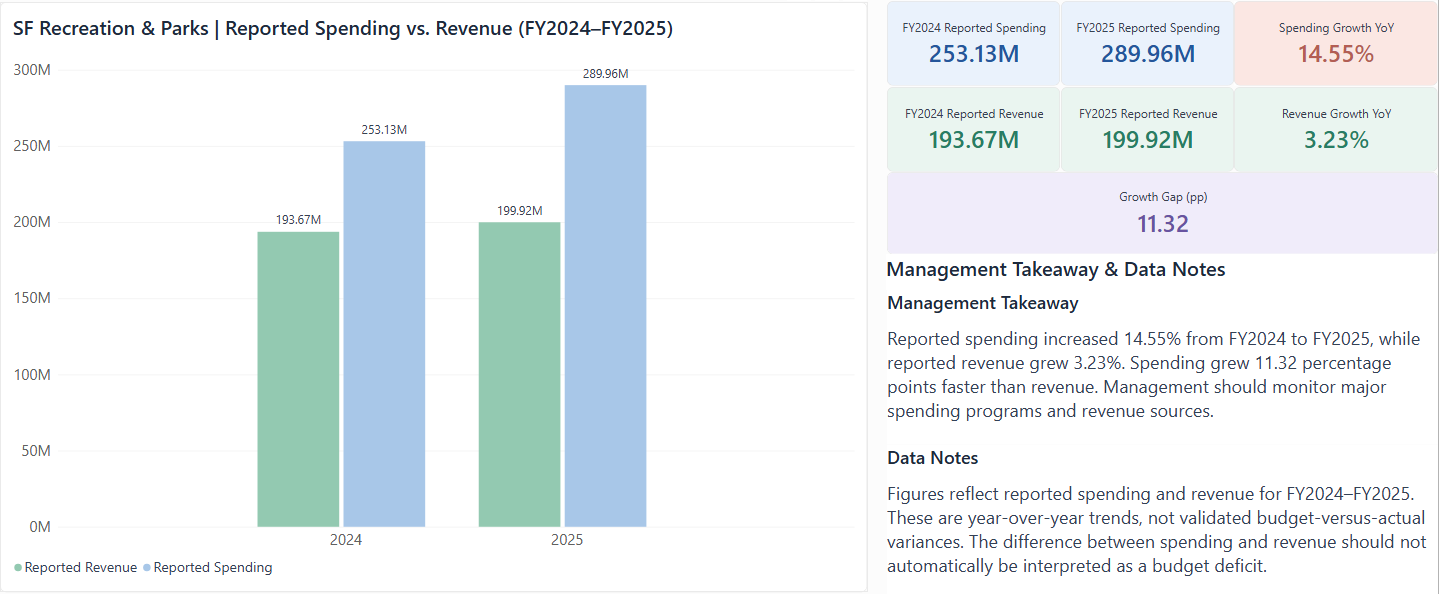
I extended the original financial analysis into a two-page Power BI dashboard to make spending and revenue trends easier to explore. The report brings together key financial measures, year-over-year comparisons, and category-level breakdowns in a format designed for management review.
Financial Overview
Seven KPI cards summarize reported financial activity and changes between FY2024 and FY2025, supported by visual comparisons of spending and revenue.
Spending & Revenue Breakdown
Interactive charts allow users to examine spending by program and revenue by source, helping identify categories that may warrant further investigation.
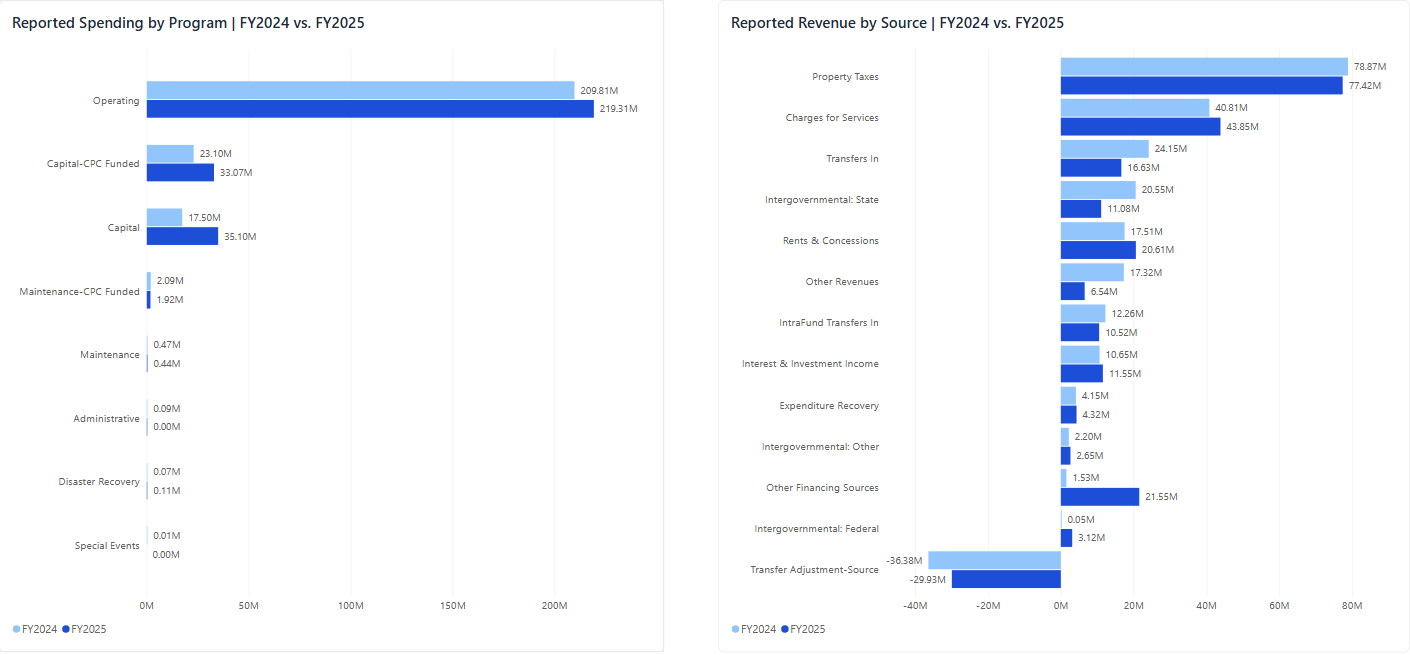
Key Findings
Result: A reusable reporting dashboard that makes the original financial analysis easier to navigate and communicate without requiring users to work directly with Python notebooks or Excel tables.
11 · Power Automate Extension
Automating report-review notifications
I created and tested a Power Automate workflow to demonstrate how routine reporting notifications can be automated. When a new file is added to a designated OneDrive for Business folder, the workflow sends an Outlook email notification containing the file name.
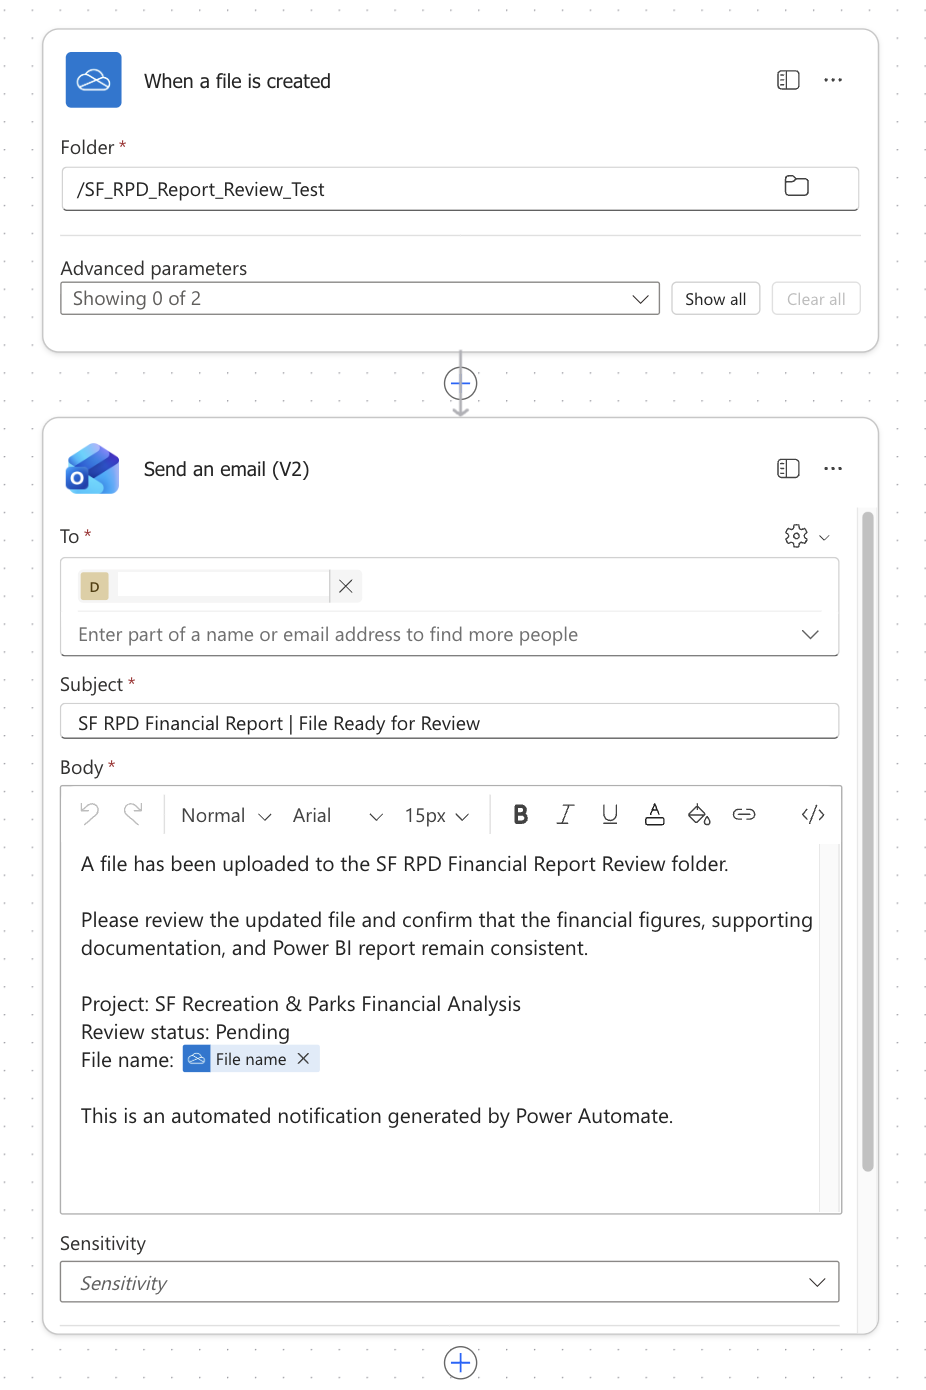
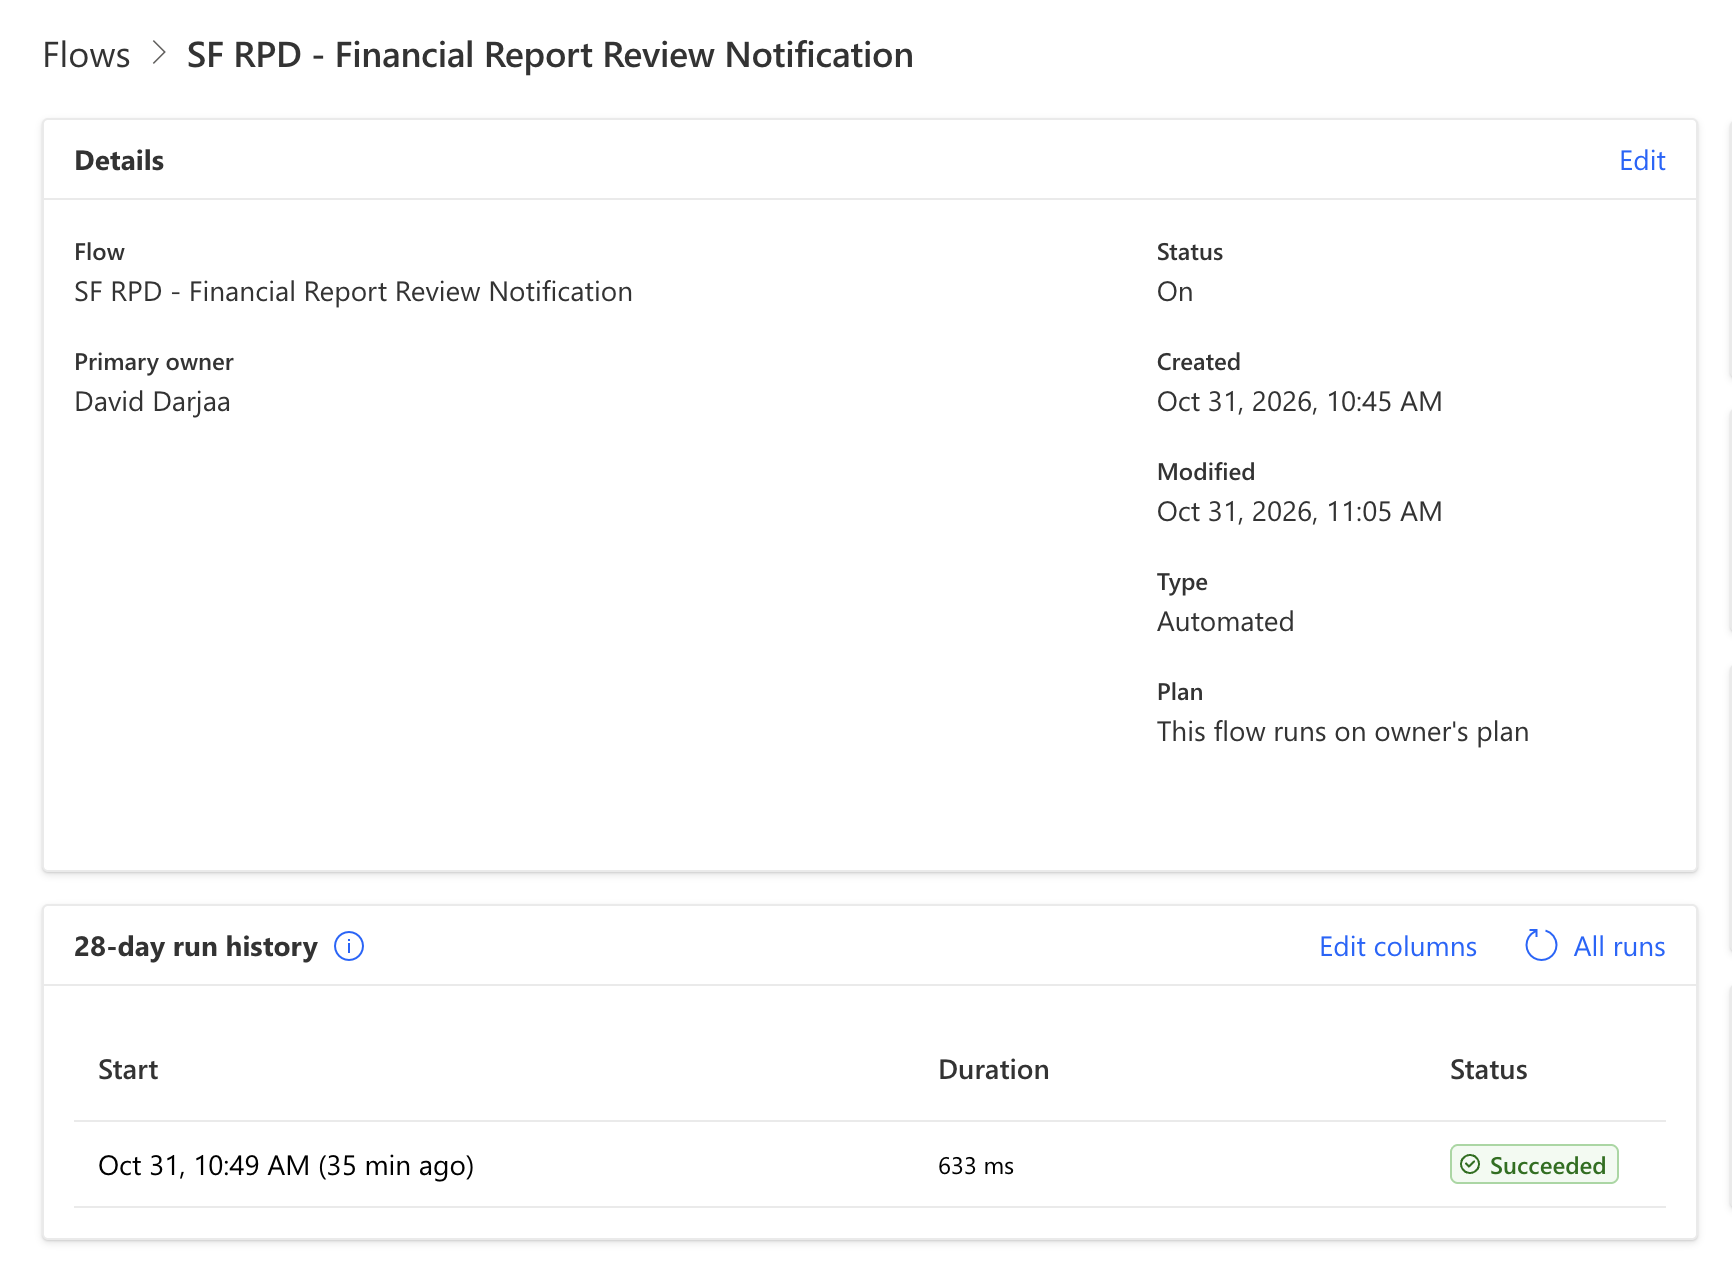
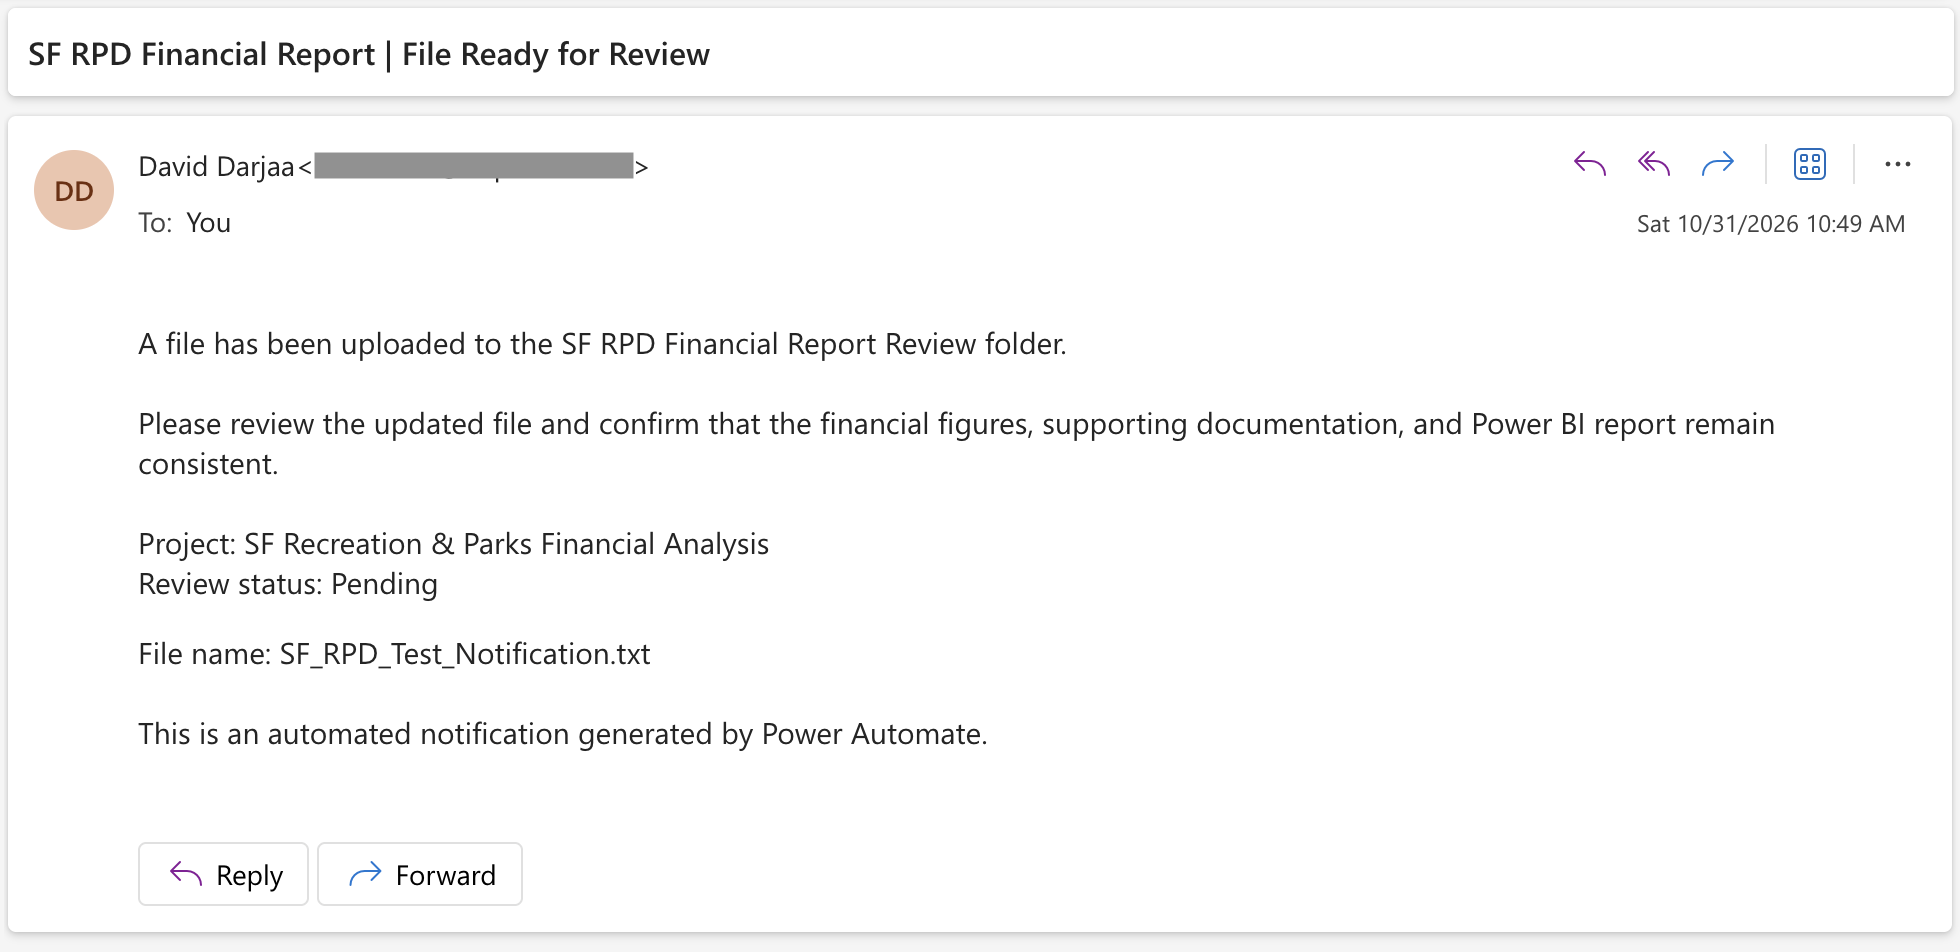
Result: A working notification workflow demonstrating how teams can reduce manual communication when new reporting files become available.
This is an independent portfolio demonstration, not a City of San Francisco deployment. The workflow sends notifications; it does not validate financial data, approve reports, or refresh Power BI dashboards.
12 · Project Deliverables
Explore the completed reports
The following reports are available for download. Source code and development notebooks are maintained in a private repository.